


“Cap rate” gets thrown around in real estate conversation as shorthand for “good deal” or “bad deal,” but an investor who wants to screen properties with a spreadsheet instead of a gut feeling needs to know exactly what the number is, why it matters, and — just as important — what it can’t tell you. Here’s the mechanics of it, before getting into which parts of Clark County actually look attractive on that basis in 2026.
What a Cap Rate Actually Measures
A capitalization rate is net operating income divided by a property’s current market value or purchase price, expressed as a percentage. Net operating income (NOI) is the rent a property collects in a year, minus operating expenses — property management, taxes, insurance, maintenance, HOA dues, and a realistic vacancy allowance — but before debt service (the mortgage payment) and before capital expenditures like a new roof. That last part matters: because cap rate deliberately ignores how a property is financed, it’s an “unlevered” number. A house generating $28,000 a year in NOI on a $400,000 purchase price has a 7% cap rate whether it was bought in cash or with a mortgage, which is exactly what makes it useful for comparing two properties that might be financed completely differently.
 Why Spreadsheet-Driven Investors Lean on It
For an investor who wants a repeatable process rather than a house they fell in love with, cap rate is the one number that lets wildly different properties get compared on equal footing — a $300,000 North Las Vegas house against an $800,000 Summerlin West listing against a Strip-corridor condo, all run through the same formula. That’s what makes a flowchart-style screen possible in the first place: set a minimum acceptable cap rate, run every active listing in a target area through the calculation, and anything below the line gets filtered out before a showing ever gets scheduled — no neighborhood reputation, no “it feels like it’s up and coming” bias creeping into the decision at the top of the funnel. Cap rate also works as a pricing signal in reverse: when cap rates compress in an area, buyers are generally paying more for the same income, usually because they’re pricing in expected appreciation or lower perceived risk; when cap rates expand, the market is typically demanding a bigger income cushion against risk. That’s exactly why the same price movement can mean two different things in North Las Vegas versus Henderson, which is the whole reason a neighborhood-by-neighborhood look matters more than one citywide average.
What Cap Rate Doesn’t Tell You
Cap rate is a snapshot of one year’s numbers, not a forecast — it says nothing by itself about future rent growth, appreciation, or which direction financing costs are headed. It’s also entirely dependent on the accuracy of the rent and expense figures fed into it: optimistic rent assumptions or an underestimated vacancy allowance produce a cap rate that looks better than the property will actually perform. That’s precisely why a calculation run on one specific address will always beat a neighborhood-wide average, no matter how well-sourced that average is.
Context first: Las Vegas isn’t the investor magnet it was a couple of years ago. Redfin found that investor purchases in the Las Vegas metro fell 20% year over year in the third quarter of 2025, the steepest pullback among the major metros it tracks. That’s a real shift — Las Vegas was, as recently as the third quarter of 2024, one of the metros with the largest share of investor home purchases in the country. Less competition from other buyers on a given house can be an opening for an investor willing to underwrite an area on its current numbers rather than its recent reputation.
North Las Vegas: The Cash-Flow Play
North Las Vegas overall is running around a $415,000 median sale price, with homes moving in about 46 days on roughly 3.5 months of supply — the most affordable entry point of any major submarket in the valley. Inside North Las Vegas, Aliante has traded around $435,000, up 3.7% year over year, offering planned-community amenities at a noticeably lower price than Summerlin. A lower entry price relative to achievable rent is generally what pulls cash-flow-focused investors to this side of the valley, though it typically comes with more tenant turnover than the premium submarkets.
Henderson: A Mixed Signal Right Now
Henderson has been marketed for years as the valley’s steady, appreciation-first submarket, and the last year of data is a reminder to underwrite current numbers rather than reputation. Zillow shows Henderson home values down roughly 8% year over year, a sharper pullback than Redfin’s numbers for the same city, which is itself useful information about a market in transition. At the neighborhood level, Green Valley Ranch sold at a $575,000 median in March 2026, down 7.3% year over year, with homes now taking about 70 days to sell versus 38 days a year earlier — a real slowdown in turnover. Green Valley South was softer still, at a $447,000 median over the three months ending in May, down 10.6% year over year. None of these rules Henderson out for a patient, long-term hold, but it argues against treating the area’s reputation as a substitute for current comps.
Summerlin: Premium Entry, Two Different Stories
Summerlin illustrates why neighborhood-level numbers matter more than a community’s overall brand name. Summerlin as a whole priced around $642,000 last month, down 1.5% year over year, but Summerlin West sold around $805,000, up 5.2% year over year, while Summerlin South’s average home value sat near $718,682 and roughly flat over the past year. Three sub-areas of one master-planned community, three different trend lines — for an investor, “Summerlin” isn’t one market, it’s several.
Northwest Las Vegas: Three Neighborhoods, Three Signals
The northwest corridor tells a similar story to Summerlin, just at a lower price point. Centennial Hills priced around $495,000, up about 1% year over year, with homes selling in roughly 52 days — steady, unremarkable, the kind of market that rewards patience. Skye Canyon, over the three months ending in March, sold at a $592,000 median, up 2.1% year over year, but homes are now taking about 83 days to sell versus 72 a year ago, with sales volume down from 76 homes to 46 over the same stretch — a slower-moving market than the price alone suggests. Northern Terrace at Providence, by contrast, sold around $477,000 with homes moving in just 26 days — the fastest turnover of the three. Same corridor, same general price band, three different absorption stories.
Southwest: Enterprise and Spring Valley
Enterprise ran a $488,000 median in March 2026, up 1.7% year over year, with a 66-day average time on market, while Spring Valley softened more noticeably, averaging $425,000 last month, down 12.4% year over year, with days on market stretching to 67 from 50 a year ago. Spring Valley’s pullback in particular is worth digging into on a specific property before assuming it’s still the safe middle path it’s been in past cycles. The broader Southwest Las Vegas submarket is worth the same close look rather than a glance at the area’s reputation.
The Strip High-Rises: A Different Asset Class Entirely
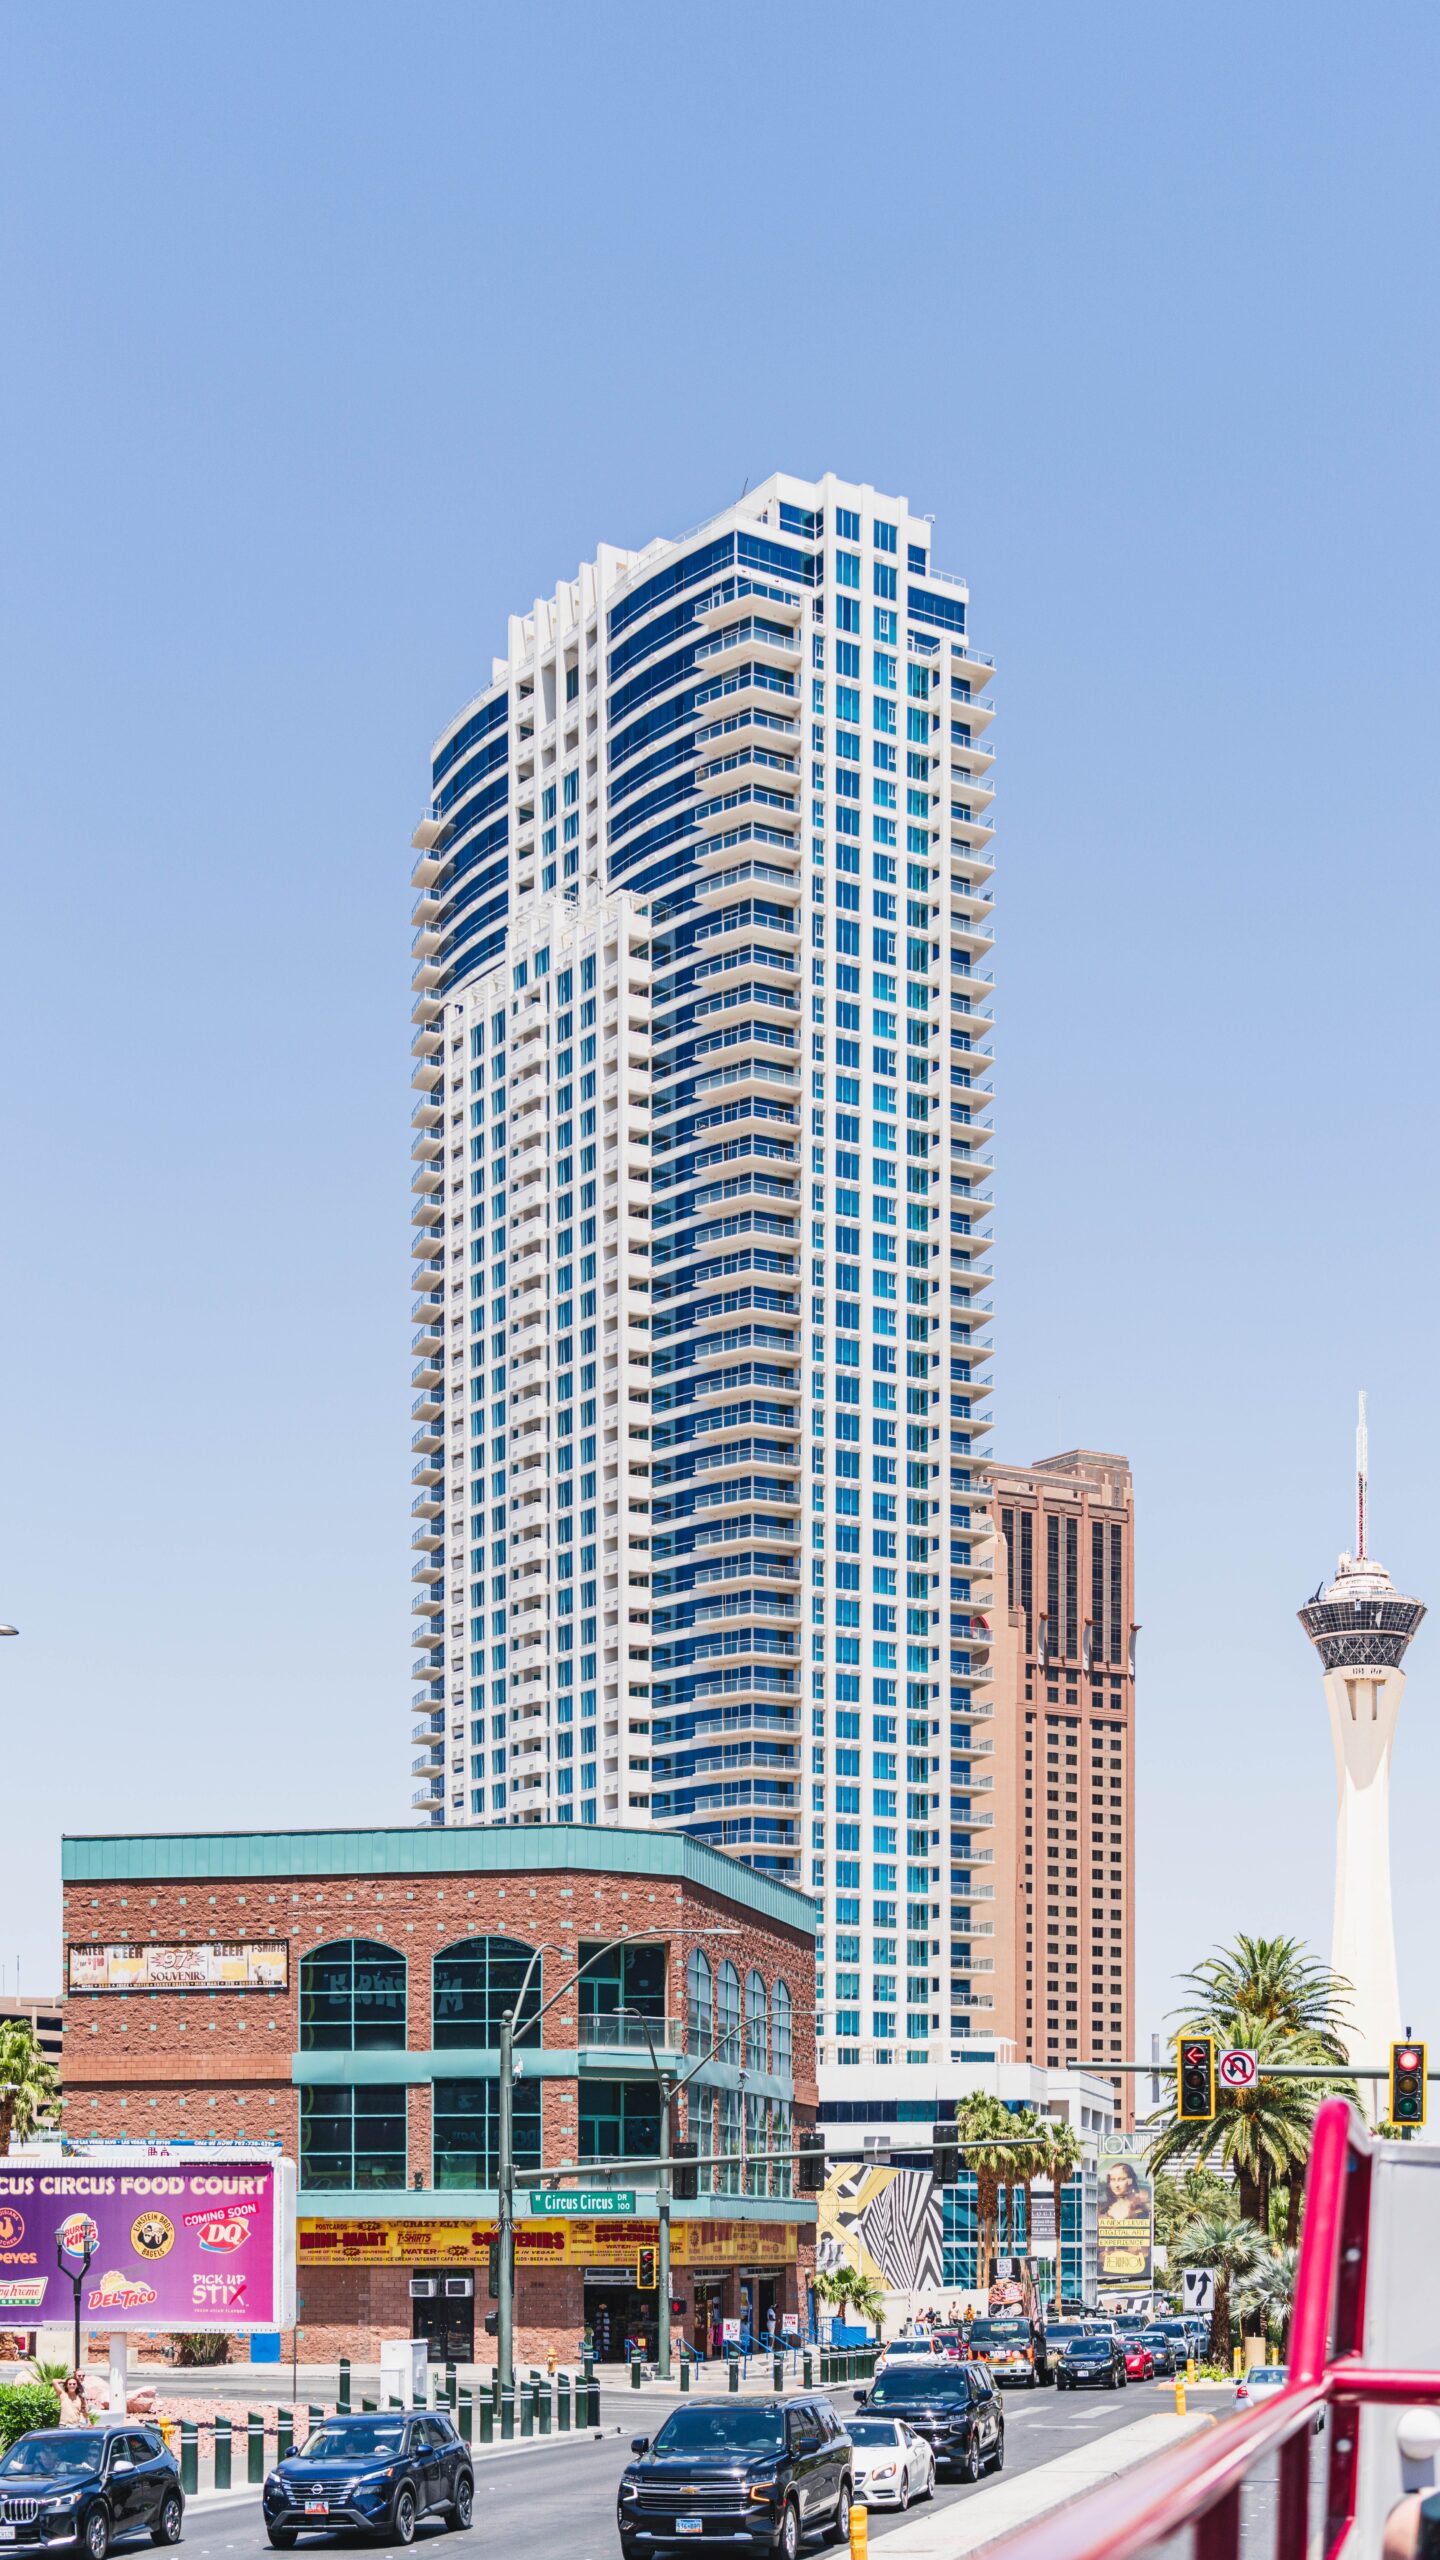
Cap rate logic changes almost completely once you leave single-family rentals for a Strip-corridor high-rise. Buildings like Turnberry Place, a four-tower, 720-unit complex technically located in Winchester, an unincorporated Clark County township rather than the City of Las Vegas, are governed first by their own HOA rules and only then by county ordinance. Whether a unit can be rented nightly, monthly, or only on a long-term lease is set building by building at the HOA level — and even where an HOA allows it, Clark County’s own short-term rental licensing rules still have to be satisfied on top of it. Financing is its own consideration too: many Strip-corridor towers carry high enough investor-ownership concentrations that they fall outside conventional “warrantable” condo financing, pushing buyers toward cash or portfolio lending. None of this shows up in a per-square-foot price comparison, but it changes the actual return math more than location does.
 Downtown: Two Different Stories in the Urban Core
Downtown splits into its own tale of two markets. The Arts District sold at a $525,000 median in November, up 12.8% year over year, but homes are now sitting for about 95 days versus 28 days a year earlier — rising prices with cooling turnover, a combination worth noting rather than assuming means the same thing it usually does. A few blocks over, Downtown Las Vegas’s broader housing market averaged $322,000 last month, down 26.2% year over year — a much cheaper, much more volatile entry point than the Arts District a short walk away. New luxury apartment supply is also opening in the Arts District and nearby Symphony Park, which is worth factoring into any rental assumptions for the area — more competing supply generally means less pricing power for an existing rental.
Boulder City: Scarcity by Law, Not by Market
Boulder City is the one Clark County market where supply is limited by ordinance, not by land, lenders, or builder appetite. The city’s decades-old Controlled Growth Ordinance caps new residential building permits at 120 per year, with no more than 30 allotments going to any single development, and because so much of the surrounding land is federal or part of Lake Mead National Recreation Area, there’s little developable ground left even for whatever permits are issued. Zillow puts the average Boulder City home value at $471,425, down about 1.2% over the past year, and Redfin’s tracking shows a similarly quiet market relative to the rest of the valley. For an investor, Boulder City isn’t a cash-flow or appreciation play in the conventional sense — it’s a bet on structural scarcity that the rest of Clark County simply doesn’t have.
Why We’re Not Giving You One Cap Rate Number
As the numbers above show, price alone swings by close to $500,000 depending on whether a property sits in North Las Vegas or Summerlin West, and a Strip high-rise or a Boulder City home plays by an entirely different set of rules than either one. Two independent, neutral starting points are worth bookmarking for estimating either side of the rent-versus-price equation on a specific property: HUD’s FY2026 Fair Market Rent documentation for the Las Vegas-Henderson-North Las Vegas metro for a rent baseline, and Las Vegas REALTORS’ current housing market statistics for pricing. An area-wide average cap rate is a rough guide at best; the only cap rate that actually matters is the one calculated on the specific address being considered.
Nevada’s investor pullback doesn’t mean Clark County stopped being worth paying attention to — it means the properties that still cash flow or appreciate are more specific to their block, their building, or even their city’s own zoning history than they were two years ago, and are worth underwriting that way.
This is the same neighborhood-by-neighborhood analysis our team walks every investor through — not just something we’re writing about — and we’re glad to help whether you’re comparing submarkets across the valley, weighing a Strip high-rise, or looking at Boulder City for the first time. Reach out to Premier Homes Real Estate to look at specific properties, or Premier Homes Property Management if you’d like a read on achievable rent before you buy.